 Foto: forzaq8 from kuwait, kuwait · CC BY 2.0 · Wikimedia Commons
26,726 bets, and no way to profit from them
A year ago we wrote about what we look for inside the odds. Today we write about the less pleasant part, the one that usually does not get published: the reckoning of what happens if you bet systematically and without a real edge.
We took four complete seasons, from 2021-22 to 2024-25, five leagues, two markets, and we simulated every single match. Flat one-unit stake, reference price the median market odds, no clever selection: everything goes in.
That is 26,726 bets. The final tally is minus 1,641 units.
What we simulated, in plain words
Only two markets, the most popular ones by far.
The first is Over/Under 2.5: you bet on whether more than two goals are scored in the match, or fewer. The second is Goal/NoGoal: you bet on whether both teams score, or not.
For every match we took the median odds among those available on the market, meaning a realistic price rather than the best one around. Then we bet one unit on each of the four possibilities, match after match, season after season. No filters, no model: this is the baseline test, the one that tells you what happens to anyone who plays all the time.
The result, market by market
On Goal yes, 6,706 bets, the outcome came in 54.53% of the time at average odds of 1.815. Return: -2.54%.
On Goal no, the same 6,706 matches, outcome came in 45.47% of the time at average odds of 1.991. Return: -11.37%.
On Over 2.5, 6,657 bets, 52.89% hit rate at average odds of 1.880. Return: -4.37%.
On Under 2.5, 47.11% at average odds of 2.101. Return: -6.27%.
None of the four roads makes money. The best one loses two and a half cents per unit staked, the worst loses more than eleven.
The number that really matters: calibration
Here comes the part that interests us most, and that almost nobody looks at.
We split all the matches into groups, based on how likely the market thought Over 2.5 was, and then we counted how often it actually happened.
In the group where the market said 45.78%, Over came in 44.24% of the time. In the one at 54.70%, it came in 56.37%. In the one at 63.62%, 66.27%. In the highest group, 73.21%, reality answered 74.56%.
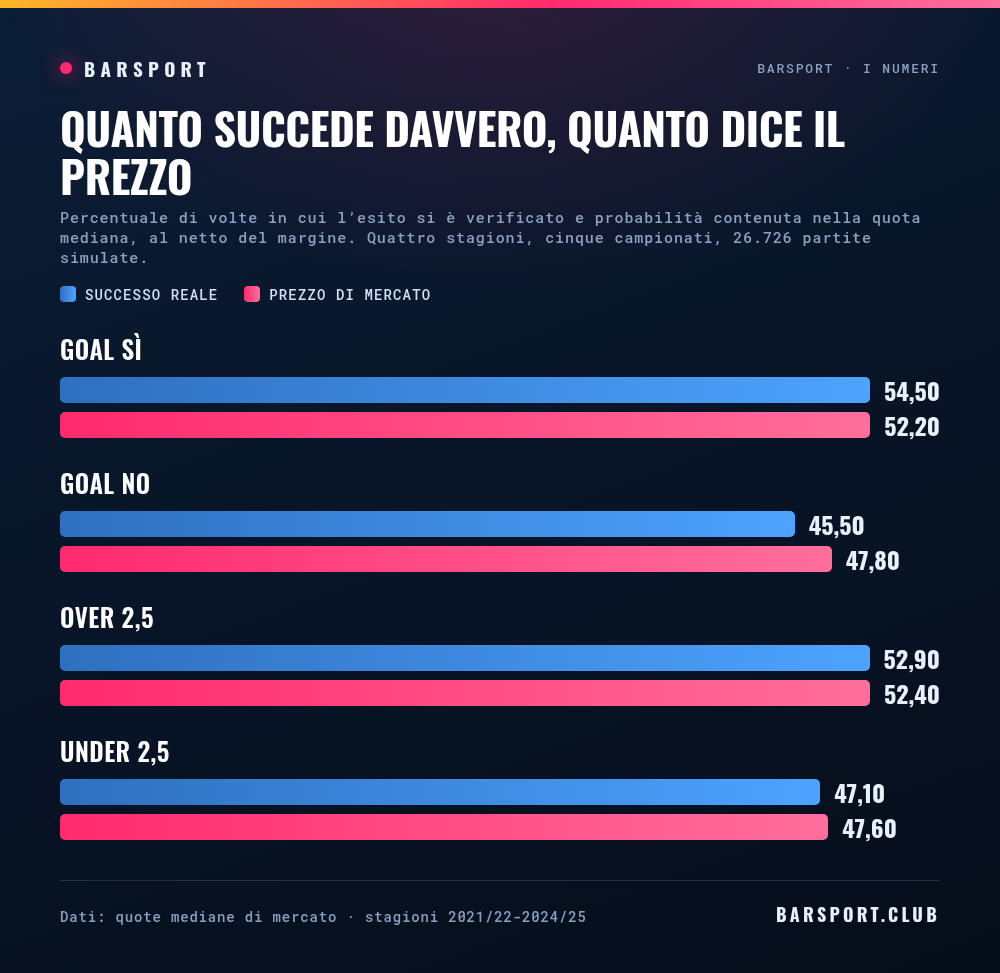
In other words: the market price is accurate. Not roughly, extremely. Across twenty-six thousand matches the gap between what the market predicts and what happens sits almost always within two percentage points, and it moves in the opposite direction to the one you would hope for: on the most likely outcomes reality beats the forecast, so the price is even a little conservative.
If the market is right and you lose 6%, there is only one reason. The bookmaker's margin. The odds we used have a payout between 93% and 95%: from there on, anyone betting blind loses by construction, no matter how good they are at reading a match.
Where the margin thins out, and where it does not
There is a difference by league worth telling, because it goes against instinct.
The English market is the one where all four roads lose more or less the same: from -4.40% to -5.83%. It is a very liquid market, with plenty of money correcting prices quickly, and indeed it leaves no holes.
In the other leagues the picture is more uneven. Goal no loses 14.42% in the Bundesliga, 13.02% in Ligue 1, 12.20% in La Liga, 11.72% in Serie A. Goal yes, in the same competitions, loses between 0.79% and 2.61%. That does not mean Goal yes is profitable: it means that in those leagues the price of "no" is systematically worse, because the instinct of people betting is to go against goals when the teams have a reputation for being defensive.
That is the first place where a model can gain something: not by predicting the future better, but by avoiding buying the expensive side of the market.
What we look for now
The honest conclusion of all this is that the simple markets are already priced well. If an edge exists, it is not in the average: it is in the cases where the perception of a team has drifted away from what that team is producing.
That is exactly what the Meritometro measures. After four matchdays of Serie A, Monza has 1 point from 7.74 expected and Bologna 1 from 6.94: they are the two most underrated teams in Italy from a performance standpoint, and in the coming weeks their price will be built on the table. On the other side Lecce has 6 points from 2.06 expected, Cagliari 9 from 5.29, Atalanta 6 from 2.33.
Outside Italy the same list says Betis, who in La Liga have 12 points from 6.29 expected, and Lille, who in Ligue 1 have 10 from 4.69. On the opposite front there are Villarreal, 2 points from 7.47 expected, and Brest, 5 from 8.98.
These are not betting tips and we do not attach odds to them, for a reason we state clearly below. They are the places where our number and the public narrative are drifting apart, and it is the only territory where, in our tests, an edge has ever made sense.
The honest part
First, what this test is not. It is not our model losing: it is the market winning against anyone who bets without a model. The simulation is there to fix sea level, not to measure our height.
Second, what we do not have. This season we have no log of real, closed and verified bets: the odds we collect stop at last spring and the rows left open in the database have never been settled. Until we restart that collection, any claim about this year's performance would be hot air, and we would rather say so than publish percentages we cannot prove.
Third, the most important thing. Even a real edge, when it exists, is small: we are talking a few percentage points over hundreds of bets, with long losing stretches in between. Betting remains gambling, and no number published here is a promise of profit. Our job is to understand football through data, and this article exists to tell the story even when the data says stop.
T.L.
Do you want to see how much each team really deserves its place in the table? The Meritometro compares actual points and expected points. For those who want the models and not the headlines, there is the Nerd Zone.